Additional Graphs
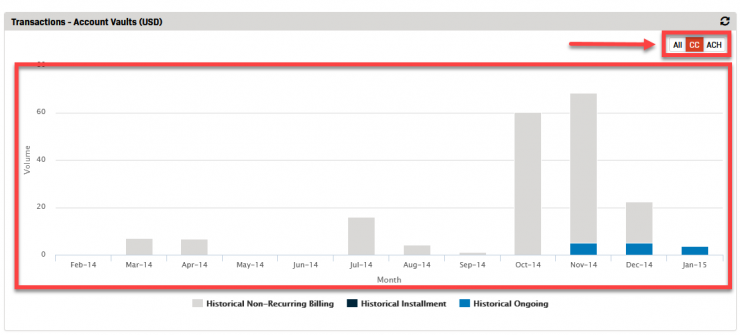
The Additional Graphs button on the Dashboard page navigates to the Transactions - Account Vaults graph. This graph reflects the total transaction volume by month that has been charged to the Account Vaults (saved accounts) under your location.
- Navigate to the Dashboard.
- Click the Additional Graphs button located just under the Transactions - History & Forecast graph.
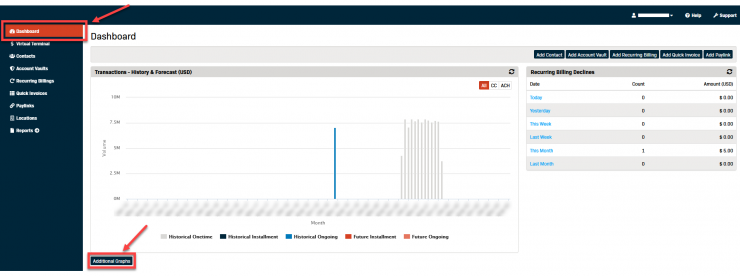
- The Dashboard - Additional Graphs page opens displaying the Transactions - Account Vaults graph.
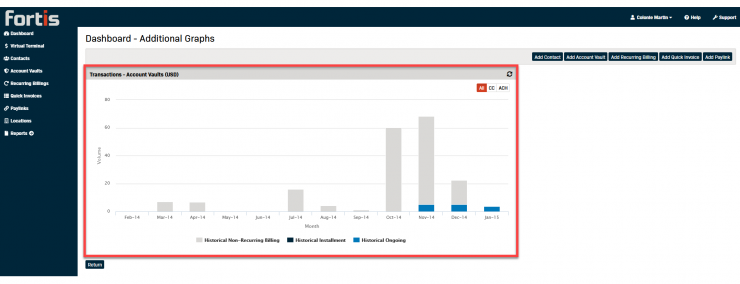
- The default settings for the graph display all the transaction volumes for Account Vaults under the current location.
Filtering the Transactions - Account Vaults Graph
The graph can be filtered for the following:
- Payment Type:
- All
- CC
- ACH
- Transaction Type:
- Historical
- Non-Recurring Billing
- Installment
- Ongoing
- Historical
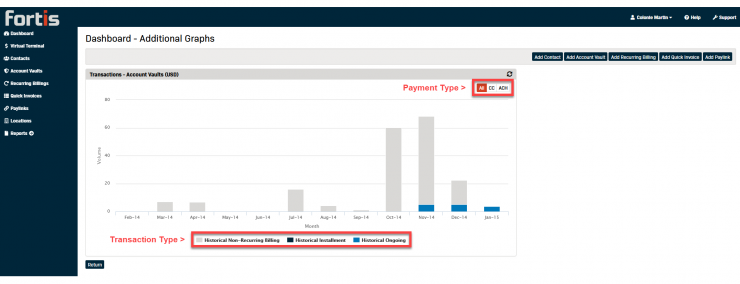
To Apply Payment Type Filters
- Click on the Payment Type button you wish to view to toggle the selection (All, CC, or ACH).
- The selected button will change color once it's active.
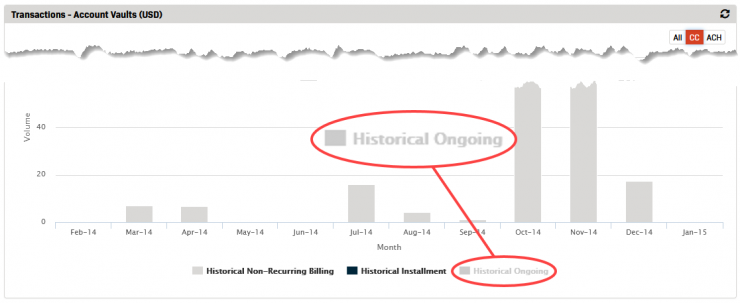
To Apply Transaction Type Filters
- Click on the Transaction Type(s) you wish to hide from the view.
- The selected Type will appear greyed out when it is deselected.